Anonymous Feedback Form
We strive to improve continuously and offer visitors the best possible experience to learn about our funds. Therefore, constructive feedback is always appreciated.
Are you missing important information?
Do you think that some sections of the website are unclear, incomplete or misleading?
Do you think that your browser is not displaying the website correctly?
Do you have any other criticism you want to share with us?
This is an anonymous feedback form. If you prefer a personal interaction, please do NOT use this form and send us your feedback by email.
A Wealth Manager's Favorite Equity Funds
Abaris Stable Equity
Steady price appreciation with low drawdowns and short underwater periods
SPY Drawdown H2/2023
Peak-To-Trough SPY (in %)
SPY Drawdown Q3/2024
Peak-To-Trough SPY (in %)
SPY Drawdown H1/2025
Peak-To-Trough SPY (in %)
Source: Abaris, LLB (data as of 31 December 2025)
Abaris Core Equity
Significant outperformance of large cap equity indices with similar or less risk
SPY Drawdown Q3/2024
Peak-To-Trough SPY (in %)
Recovery (in # Trading Days)
SPY Drawdown H1/2025
Peak-To-Trough SPY (in %)
Recovery (in # Trading Days)
Source: Abaris, LLB (data as of 31 December 2025)
Abaris Stable Equity
Steady price appreciation with low drawdowns and short underwater periods
SPY Drawdown H2/2023
Peak-To-Trough SPY (in %)
SPY Drawdown Q3/2024
Peak-To-Trough SPY (in %)
SPY Drawdown H1/2025
Peak-To-Trough SPY (in %)
Source: Abaris, LLB (data as of 31 December 2025)
Explanatory Notes
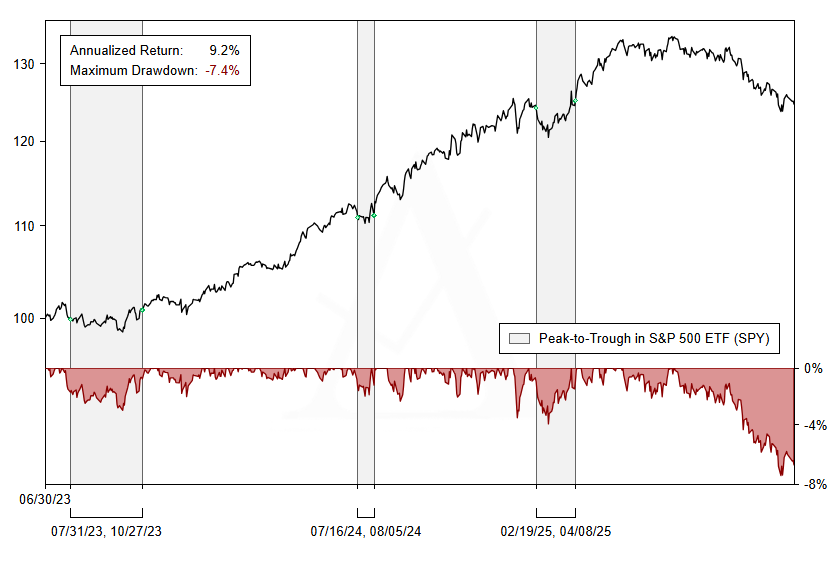
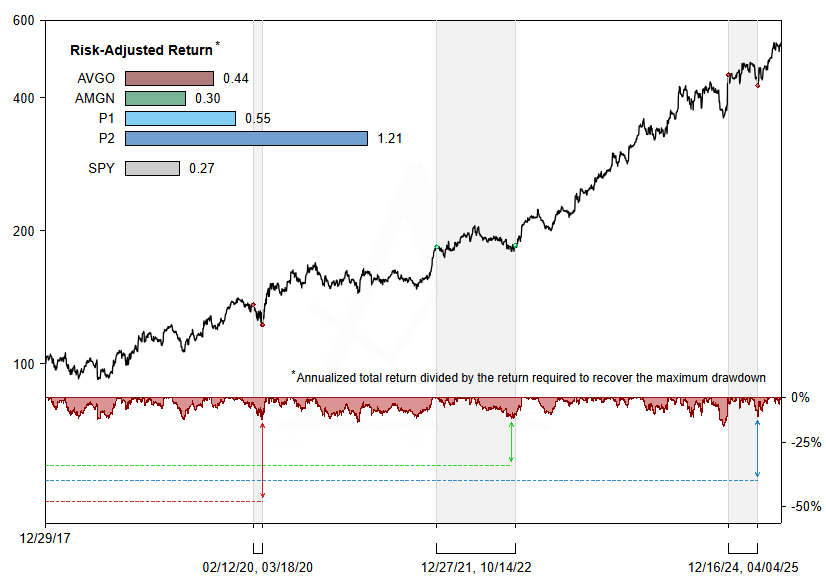
The track record chart has been designed to allow for a comprehensive analysis in three dimensions: return, risk and diversification benefit.
The chart shows the total return of the fund’s reference share class (A USD) since fund inception (upper chart panel) and the corresponding drawdown periods (lower chart panel). The risk-adjusted performance is summarized with the annualized return since inception and the maximum peak-to-trough drawdown (legend in the upper left corner).
To assess the fund's diversification benefit, the grey shaded areas highlight the largest peak-to-trough drawdown periods of the S&P 500 ETF (SPY). If you click on the grey shaded drawdown areas, the details of the respective periods are shown, including the peak-to-trough loss of SPY and the fund’s return in the same period. To further illustrate that the fund’s drawdown periods do not correspond to the drawdown periods of the equity market, small green diamonds at SPY’s peak and trough (beginning and end of the grey shaded areas) indicate the fund’s positive return in all three equity stress periods.
Track Record
Since inception, the fund has generated strong returns with low draw-downs and short underwater periods. Despite being fully invested in equities, the fund has achieved positive returns even in equity stress periods, demonstrating both superior stock selection and highly effective risk management.
Abaris Core Equity
Significant outperformance of large cap equity indices with similar or less risk
SPY Drawdown Q3/2024
Peak-To-Trough SPY (in %)
Recovery (in # Trading Days)
SPY Drawdown H1/2025
Peak-To-Trough SPY (in %)
Recovery (in # Trading Days)
Source: Abaris, LLB (data as of 31 December 2025)
Explanatory Notes
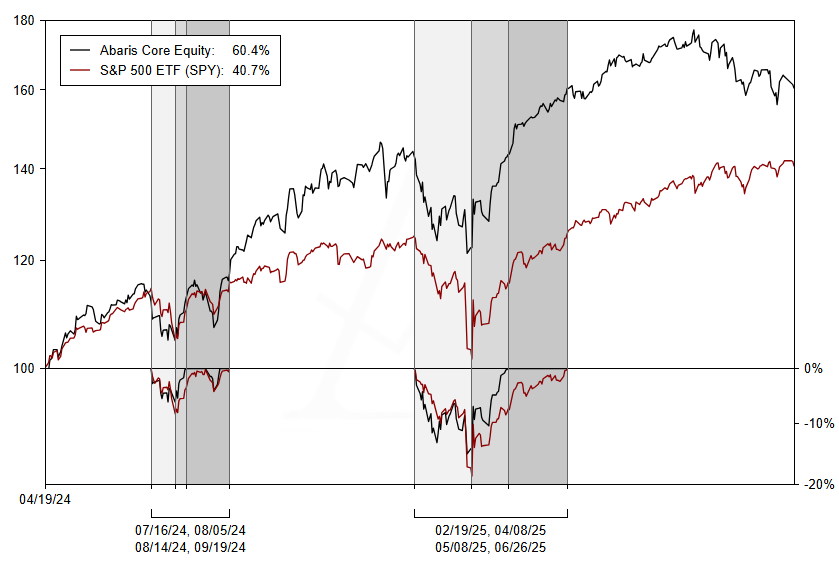
The track record chart has been designed to allow for a comprehensive analysis of both the fund's outperformance and its behavior in equity stress periods.
In the upper chart panel, the chart shows the total return of the fund’s reference share class (A USD) since fund inception compared to the S&P 500 ETF (SPY), which we consider to be the strongest benchmark among broadly diversified large cap equity indices. Both returns since fund inception are summarized in the upper left corner.
To assess the fund's behavior in equity stress periods, the grey shaded areas highlight the largest drawdown periods of the S&P 500 ETF (SPY), starting at SPY’s peak (first date), passing SPY’s trough (second date) and ending when SPY has fully recovered its losses (fourth date). The third date marks the fund’s recovery date, indicating a faster recovery than SPY. If you click on the grey shaded drawdown areas, the details of the respective periods are shown. The lower chart panel shows the relative performance of the fund compared to SPY in the grey shaded equity stress periods, starting at SPY's respective peak date.
Track Record
Since inception, the fund has significantly outperformed the S&P 500 ETF, while consistently falling less and recovering faster in equity stress periods, demonstrating that its outperformance results from superior stock selection (alpha) and not higher market risk (beta).
Value Creation Drives Stock Returns
"We harness the power of compounding by investing in high-quality companies with superior risk-adjusted value creation."
Explanatory Notes
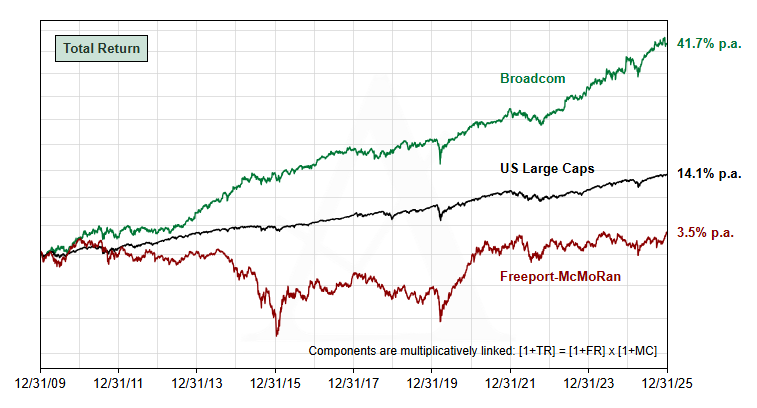
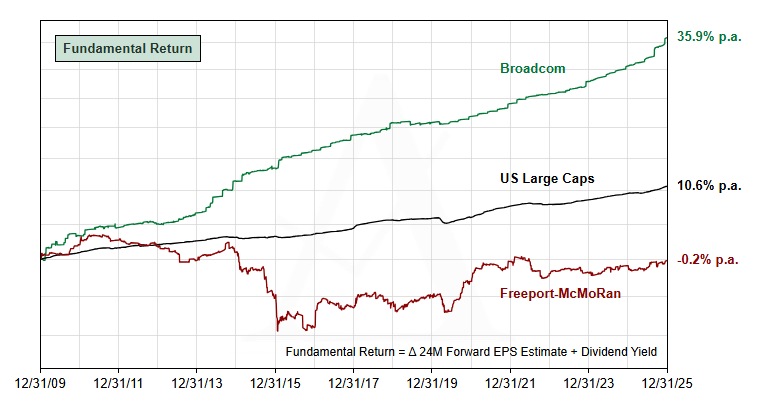
We decompose stock returns into a fundamentally relevant metric (e.g. earnings per share) and a valuation multiple (e.g. price/earnings ratio), usually based on forward-looking consensus estimates. The appropriate metric is chosen based on a company's business model, growth stage and leverage. The part of a stock's total return, which cannot be attributed to changes in the valuation multiple, is called fundamental return, value creation (if positive) or value destruction (if negative).
As valuation multiples fluctuate sideways over long time horizons, total return converges towards fundamental return, making fundamental return the best predictor of long-term stock returns.
Explanatory Notes
High-quality companies with superior risk-adjusted value creation usually have a scalable business model with attractive organic growth rates and strong cash generation, target large addressable markets with limited economic sensitivity, possess durable competitive advantages with strong pricing power and pursue thoughtful capital allocation and acquisition strategies.
After pre-screening for attractive companies quantitatively, we make a qualitative assessment of a company's future value creation potential and key business risks. We usually stay invested as long as a company's valuation multiple is acceptable relative to peers and our future fundamental return expectations.
Source: Abaris calculations (data as of 31 December 2025)
Building Robust Equity Portfolios
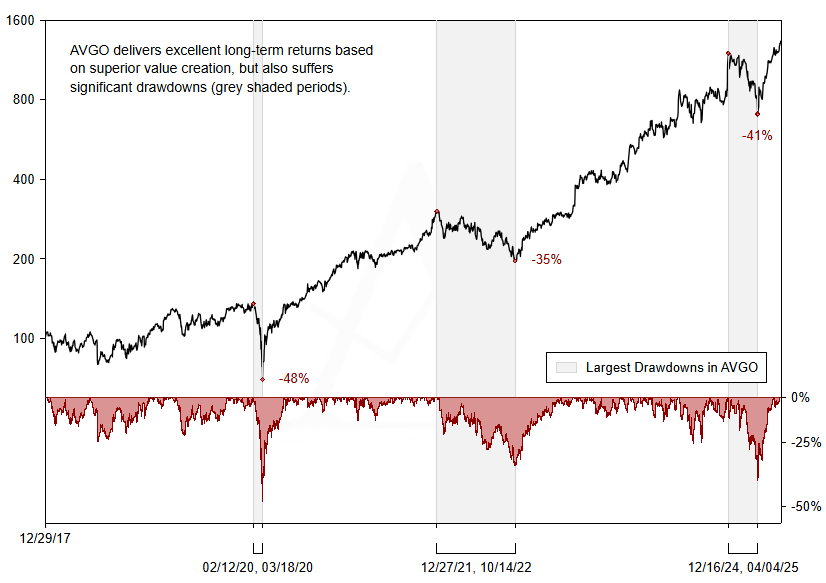
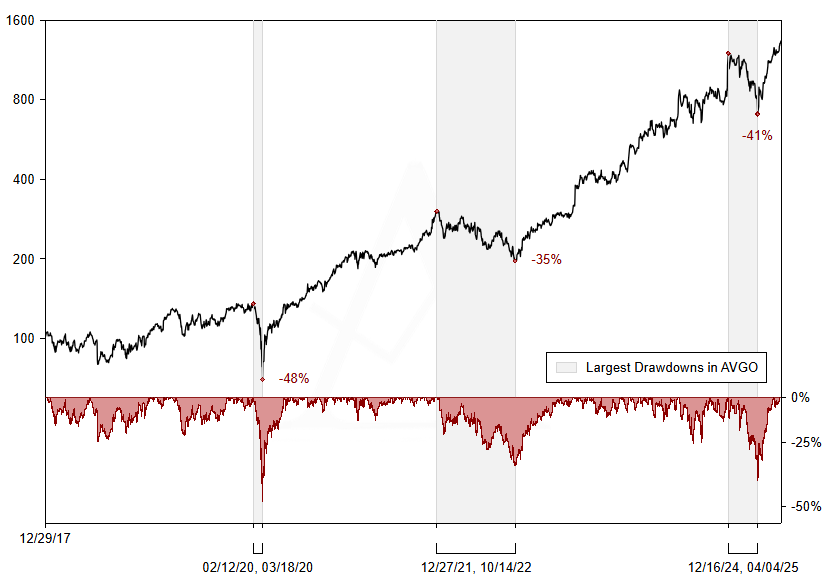
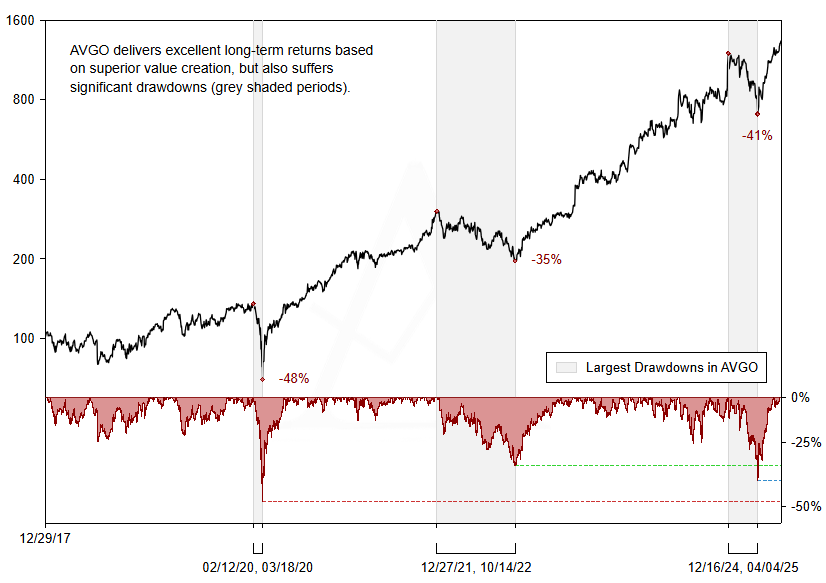
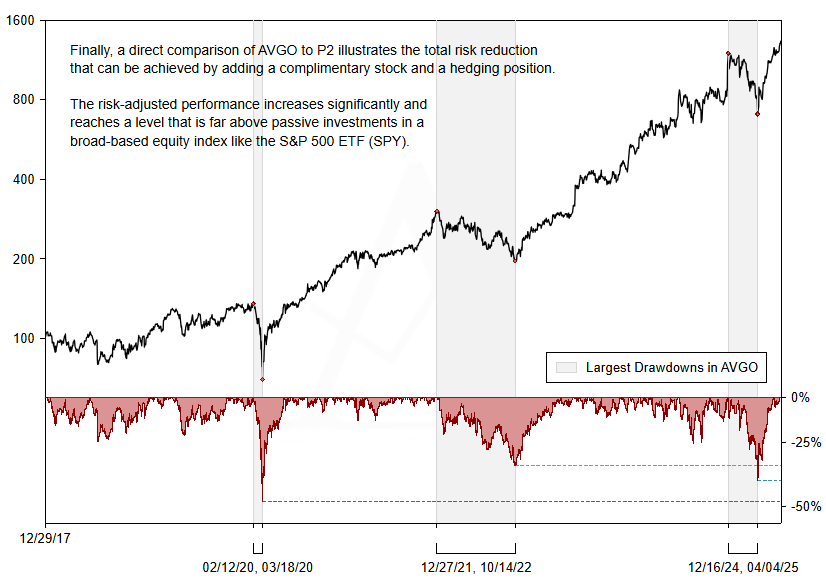
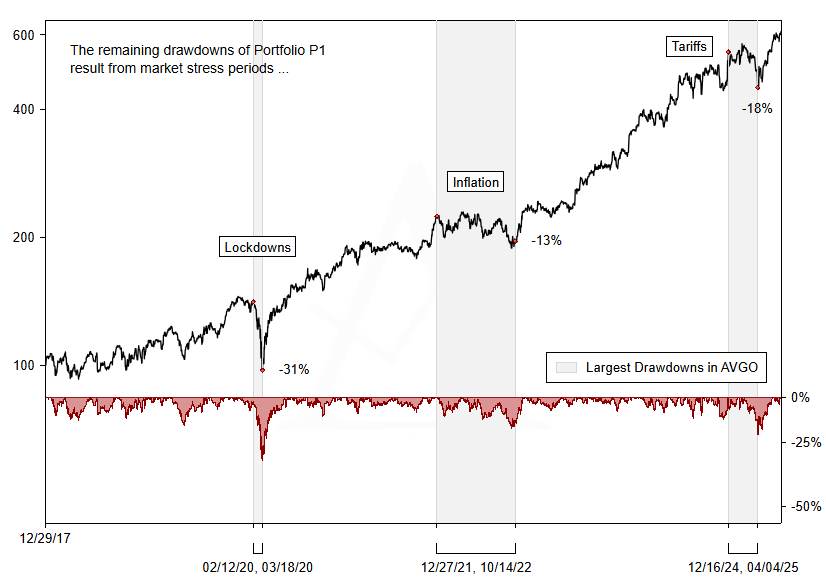
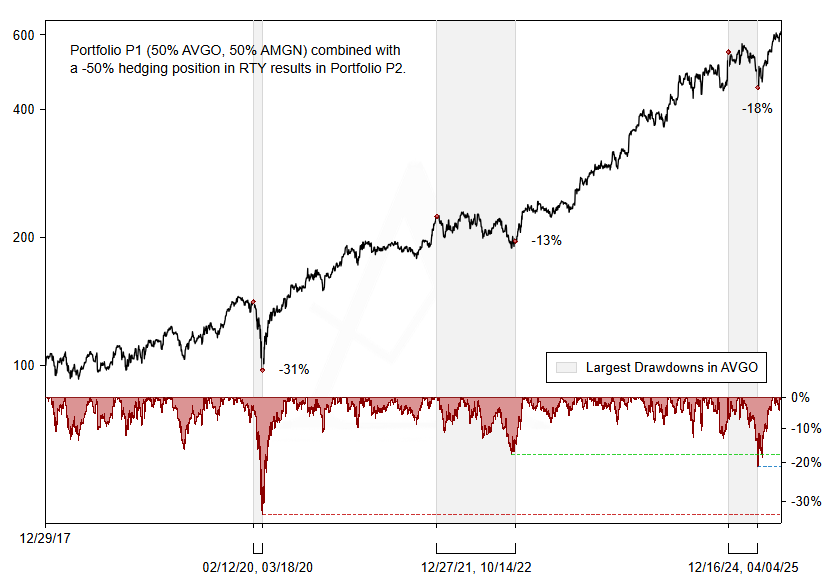
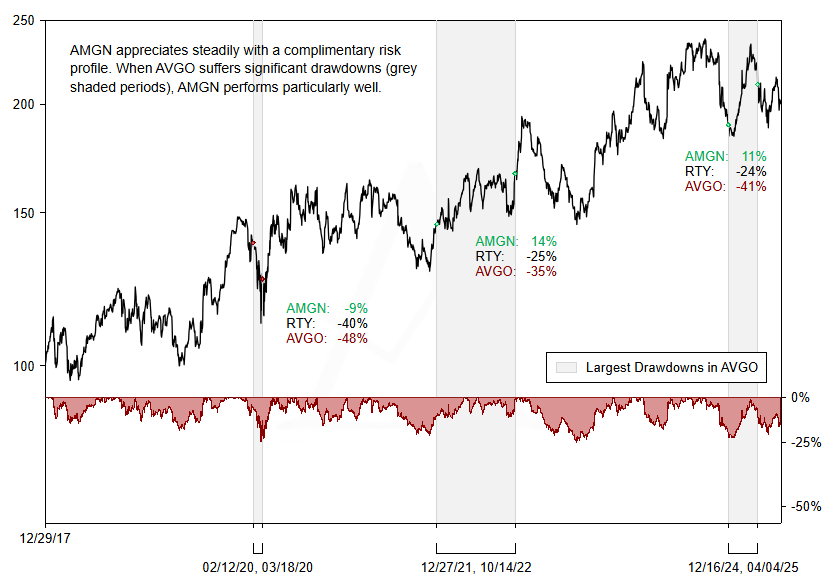
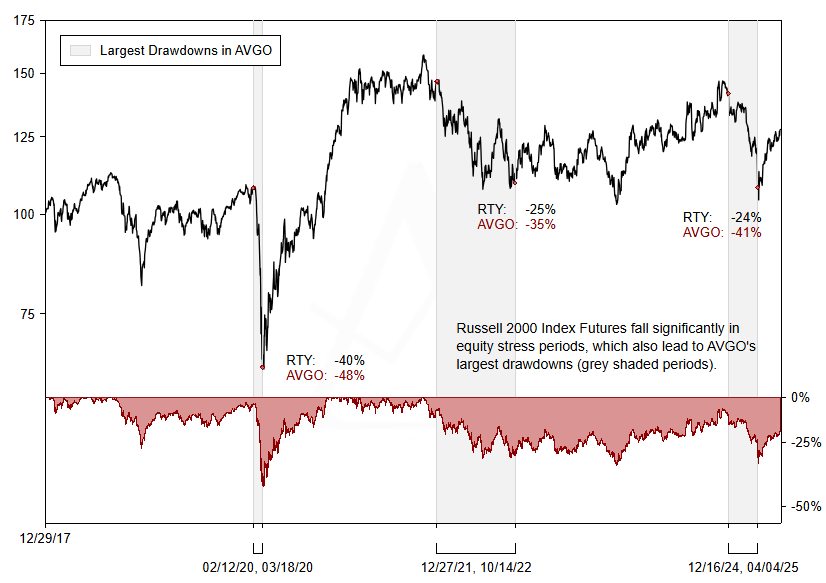
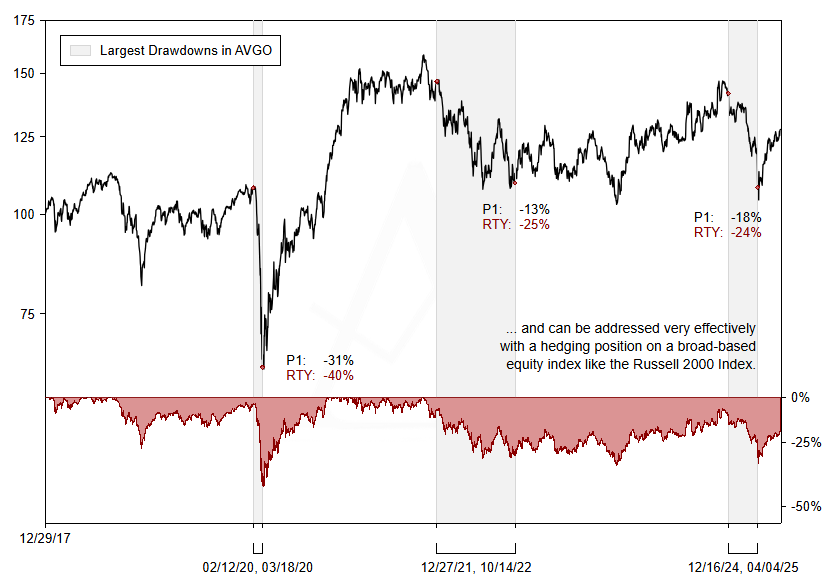
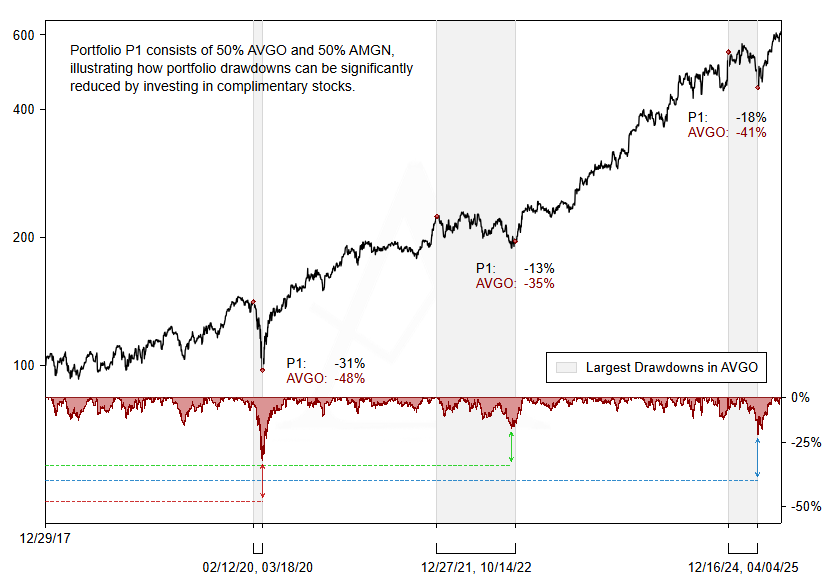
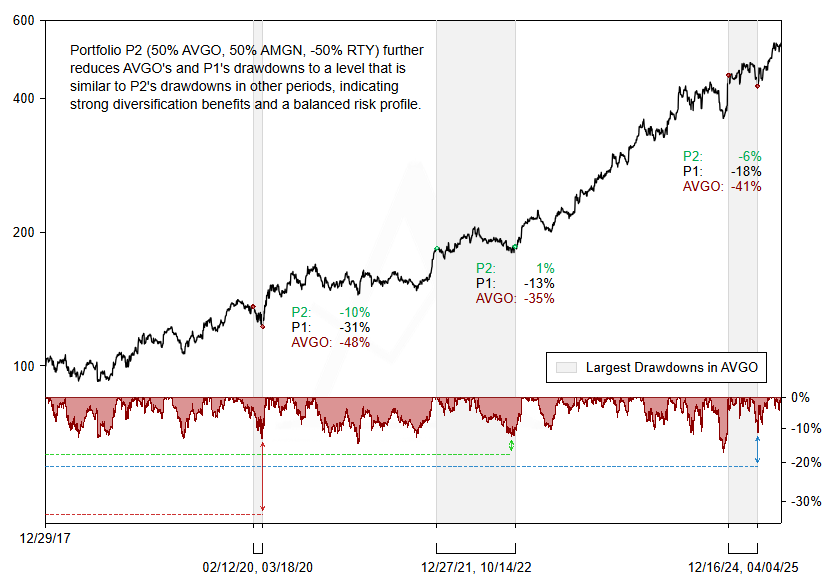
"We build robust equity portfolios by investing in complimentary stocks combined with hedging positions."
Source: Abaris calculations (data as of 30 June 2025)
Source: Abaris calculations (data as of 30 June 2025)


